Monitoring distributed software architectures has traditionally relied on metrics, logs, and distributed traces centered around deterministic HTTP requests and database queries. As production architectures shift toward autonomous agents, multi-step retrieval-augmented generation (RAG) pipelines, and chain-of-thought inference loops, standard application performance monitoring (APM) tools struggle with the non-deterministic execution paths, large token payloads, and variable latencies inherent to generative systems.
Tracking LLM applications requires capturing structured execution trees: prompts, tool invocations, vector search parameters, intermediate reasoning tokens, cost metrics, and downstream evaluation scores. Today, engineering teams choose between several distinct architectural paradigms for LLM observability. This analysis evaluates the underlying architectures, OpenTelemetry semantic standards, ingestion mechanics, and operational trade-offs of the leading approaches: Langfuse, Arize Phoenix, OpenInference, and Helicone.
The GenAI Telemetry Model: Traces, Spans, and Events
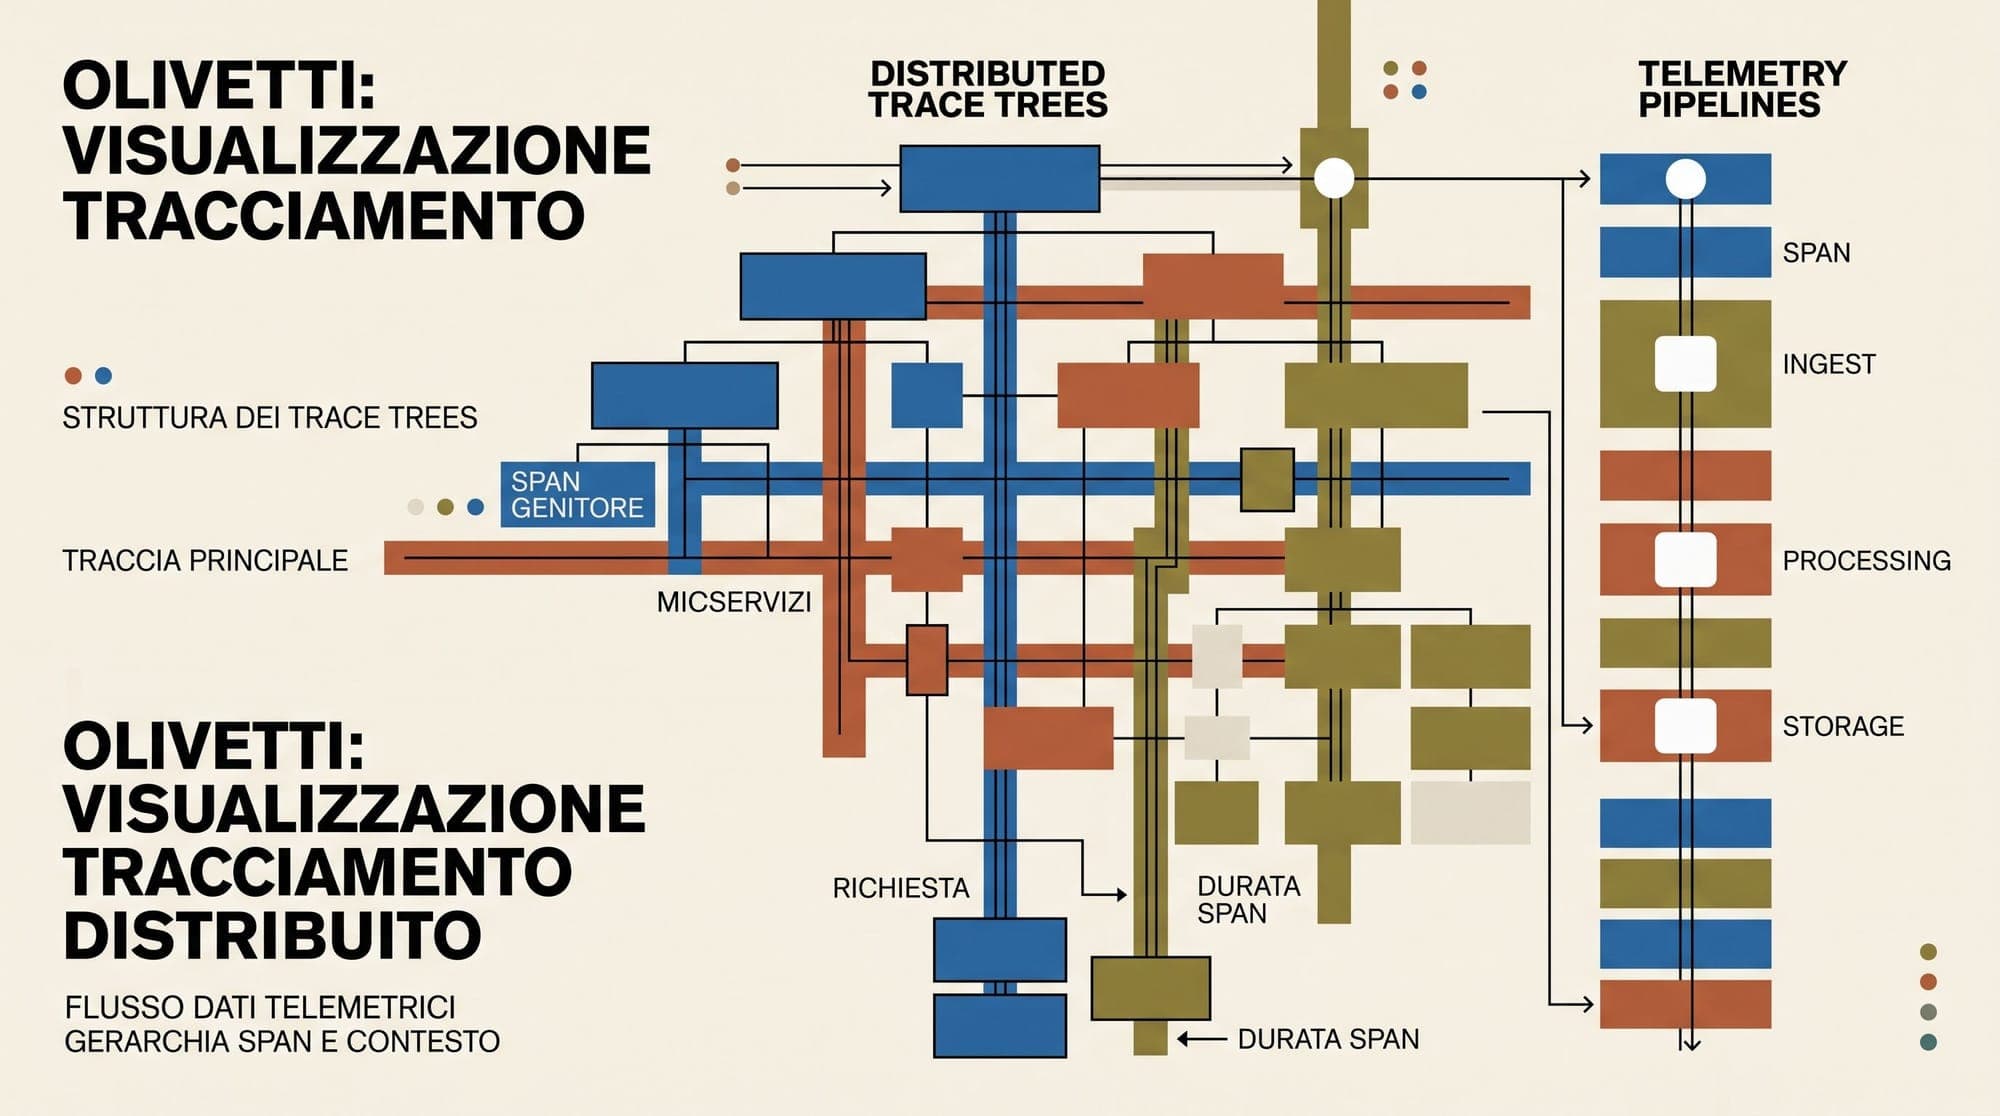
A traditional microservice trace tracks discrete remote procedure calls across service boundaries. In contrast, an LLM execution trace represents a hierarchical directed acyclic graph (DAG) of generative actions and deterministic tool interactions.
The hierarchy consists of three core layers:
- Root Trace: The end-to-end user request or scheduled agent lifecycle. It aggregates cumulative cost, total latency, total input and output tokens, and final user session identifiers.
- Intermediate Spans: Structured sub-operations within the workflow. Typical span types include retrieval steps (vector database queries, similarity thresholds, top-k results), tool executions (sandboxed Python interpreters, web search API calls), and internal planning routines.
- Leaf Spans and Events: Individual LLM inference calls and discrete token generation events. These capture model parameters (temperature, top_p, frequency penalties), token usage breakdowns, time-to-first-token (TTFT), and raw prompt/completion strings.

Standardizing Telemetry: OpenTelemetry GenAI Conventions and OpenInference
Historically, proprietary SDKs resulted in tight platform lock-in, where swapping an observability vendor required rewriting every logging decorator. Two open standards have emerged to unify LLM telemetry.
OpenTelemetry GenAI Semantic Conventions
The Cloud Native Computing Foundation (CNCF) and the OpenTelemetry GenAI Special Interest Group established formal semantic conventions under the gen_ai. namespace. These conventions standardize attribute keys across programming languages:
gen_ai.system/gen_ai.provider.name: Identifies the target provider (e.g., openai, anthropic, bedrock, vllm).gen_ai.request.modelandgen_ai.response.model: Distinguishes the requested model alias from the exact served model snapshot.gen_ai.operation.name: Standardized operation categories, includingchat,text_completion, andembeddings.gen_ai.usage.input_tokensandgen_ai.usage.output_tokens: Integer metrics defining token consumption for billing and quota tracking.gen_ai.request.temperature,gen_ai.request.top_p,gen_ai.request.max_tokens: Captures decoding parameters directly on the span.
OpenInference
Maintained under the OpenInference specification, this standard builds directly on top of OpenTelemetry to extend semantic typing specifically for complex agent and RAG workflows. While core OpenTelemetry GenAI conventions focus heavily on model-level metrics, OpenInference introduces explicit span categories:
RETRIEVER: Maps input query strings to retrieved document chunks, document IDs, metadata, and relevance distance scores.TOOL: Records tool schema inputs, execution outputs, and execution status.AGENTandCHAIN: Defines orchestrator execution loops, state transitions, and branching logic.EMBEDDING: Telemetry for embedding model generation pipelines.
Because OpenInference spans are fully valid OpenTelemetry spans with specialized semantic attributes, any compliant OpenTelemetry collector can ingest and route them without translation proxies.
Architectural Deep Dive: Platform Comparison
Different platforms make contrasting architectural trade-offs across data ingestion pipelines, storage engines, and developer integration points.
1. Langfuse: Dual OLTP/OLAP Storage Architecture
Langfuse utilizes a bifurcated storage design built to handle high-throughput analytical queries alongside transactional application state:
- OLTP Layer (PostgreSQL): Handles relational entities, authentication, project organizations, API key management, prompt versioning schemas, and human annotation queues.
- OLAP Layer (ClickHouse): Stores high-volume telemetry records, including traces, observations, span trees, and automated evaluation scores. As documented in ClickHouse's technical review of Langfuse, columnar storage enables sub-second aggregations over billions of token events and custom metadata filters.
- Queue and Buffer (Redis / Valkey): Absorbs asynchronous trace ingestion bursts from application SDKs, preventing ingestion spikes from degrading web dashboard queries.
- Blob Storage (S3 / GCS): Offloads massive multimodal payloads, audio files, and large JSON completion histories to keep columnar database indexes compact.
Langfuse provides direct OpenTelemetry endpoint ingestion via standard OTLP protocols as well as dedicated client SDKs for Python, TypeScript, and native framework wrappers (LangChain, LlamaIndex, LiteLLM).
2. Arize Phoenix: Standards-Native OpenInference Engine
Arize Phoenix adopts an OpenInference-first approach designed for both local development and distributed clusters:
- Local Development Mode: Embeds a zero-configuration SQLite or in-memory backend directly inside Python notebooks or lightweight containers, enabling instant trace inspection during prompt prototyping.
- Production Topology: Deploys as an independent service backed by PostgreSQL or ClickHouse, acting as a native OpenTelemetry collector endpoint.
- High-Dimensional Evaluation: Phoenix features built-in vector evaluation engines. It computes UMAP (Uniform Manifold Approximation and Projection) dimensionality reductions over prompt and document embeddings directly in the UI, allowing engineers to visualize semantic drift, cluster retrieval failures, and isolate out-of-distribution user inputs.
3. Helicone: Edge Proxy Architecture
Helicone bypasses SDK instrumentation entirely by positioning itself as an intelligent reverse proxy at the network edge:
- Zero-Code Integration: Applications change only the target base URL (e.g., pointing to
oai.helicone.ai/v1instead ofapi.openai.com/v1) and pass an authentication header. - Asynchronous Edge Logging: Built on edge serverless workers (Cloudflare Workers), Helicone forwards incoming requests to the model provider, streams the response back to the client with negligible latency overhead, and asynchronously pushes telemetry to analytical storage via background queues.
- Inline Gateway Features: Because it operates directly in the data plane, Helicone provides edge-level prompt caching, tenant-level rate limiting, budget enforcement, and inline security guardrails before requests reach upstream inference endpoints.
Ingestion Economics, Storage Footprint, and Sampling Strategies
At high scale, LLM observability creates distinct operational challenges compared to traditional logging.
The Payload Volume Problem
A standard microservice span payload rarely exceeds a few hundred bytes. In contrast, an agent executing across a 128k-token context window can generate 1MB to 5MB of raw JSON text per inference step.
In a system processing 10,000 queries per minute, naively indexing raw prompt and completion strings inside standard relational databases causes severe I/O bottlenecks and rapid disk exhaustion. Production architectures mitigate this through three techniques:
- Columnar Separation: Storing queryable numeric and categorical metadata (token counts, latency, model ID, user ID, tags) in columnar stores (ClickHouse) while archiving raw prompt strings and structured JSON payloads into object storage (S3/GCS).
- Client-Side PII Scrubbing: Running regex and named-entity recognition (NER) masking within the local SDK before telemetry data exits the application virtual private cloud (VPC).
- Dynamic Span Sampling:
- Head-Based Sampling: Ingesting a fixed percentage (e.g., 5%) of uniform baseline traffic at the application boundary.
- Tail-Based Sampling: Buffering complete traces in an OpenTelemetry collector and retaining 100% of traces that trigger anomalous conditions: HTTP error codes, model timeouts, latency exceeding p95 thresholds, or low automated evaluation scores (e.g., faithfulness < 0.7).
Architectural Selection Framework
Choosing an LLM observability stack depends on infrastructure constraints and organizational priorities:
- Choose Langfuse when you require an end-to-end open-source platform with robust prompt management, team collaboration, human annotation queues, and scalable ClickHouse-backed analytics that can be self-hosted or consumed as a managed cloud service.
- Choose Arize Phoenix when your engineering workflows center on standards-based OpenInference telemetry, vector embedding drift analysis, interactive Jupyter-based troubleshooting, and RAG retrieval diagnostics.
- Choose OpenInference / OpenTelemetry native collectors when your organization enforces strict vendor-neutral telemetry infrastructure and already routes APM data through existing enterprise collectors (such as Datadog, Grafana Tempo, or Honeycomb).
- Choose Helicone when you need immediate visibility across multiple disparate codebases without altering application code, or when edge caching and global rate limiting are primary operational requirements.
Sources
- OpenTelemetry GenAI Semantic Conventions Specification
- OpenTelemetry Semantic Conventions for Generative AI Attributes
- OpenInference Telemetry Standard Repository
- Langfuse Product Architecture and Self-Hosting Documentation
- ClickHouse Technical Case Study on Langfuse OLAP Data Stack
- Arize Phoenix Documentation and Open Agent Spec Integration